Unlike descriptive statistics, which focuses on summarizing and describing data sets through various measures and visualizations, inferential statistics involves drawing conclusions and making predictions about a larger population based on data samples. This branch of statistics employs sophisticated mathematical techniques and probability theory to extrapolate findings from a smaller, representative subset to the broader population. By analyzing patterns and relationships within sample data, inferential statistics allows researchers to estimate population parameters, test hypotheses, and quantify the uncertainty associated with their conclusions.
Specifically, statistical inference aims to formulate, test, and draw conclusions about hypotheses using sample data.
Inferential statistics typically involves comparing two hypotheses:
- The null hypothesis (H0):
- Represents the status quo or absence of effect
- Acts as the default assumption we aim to disprove
- Example: “A new medication does not affect blood pressure”
- The alternative hypothesis (H1):
- Represents the opposite of the null hypothesis
- Suggests a significant effect or relationship exists
- Example: “The new medication significantly affects blood pressure”
Statistical tests are designed to evaluate the evidence against the null hypothesis, potentially leading to its rejection in favor of the alternative hypothesis if sufficient evidence is found.
Generally, researchers test the probability of observing the sample data if the null hypothesis is true. If this probability is less than 5% (or 0.05), they reject the null hypothesis in favor of the alternative hypothesis.
This probability is denoted by the letter p, so the null hypothesis is rejected if p < 0.05. This threshold is established a priori and is indicated by the Greek letter alpha.
To illustrate, consider testing a drug’s effect on a disease. The null hypothesis (H0) states that the drug has no effect, meaning there are no changes compared to the status quo despite its use. The alternative hypothesis (H1) proposes that the drug does have an effect, causing variations from the baseline condition.
We set a threshold to reject the null hypothesis if the data supporting the alternative have a probability less than 0.05 (p < 0.05). In this case, we reject H0 and accept H1, concluding the drug is effective. If p ≥ 0.05, we fail to reject H0, indicating no significant difference between using and not using the drug.
In essence, inferential statistics follows these key steps:
- Formulating hypotheses (H0 and H1)
- Collecting sample data
- Applying the statistical test
- Comparing result probabilities with alpha
- Deciding whether to accept or reject the null hypothesis based on p-value
- Generalizing results to the broader population
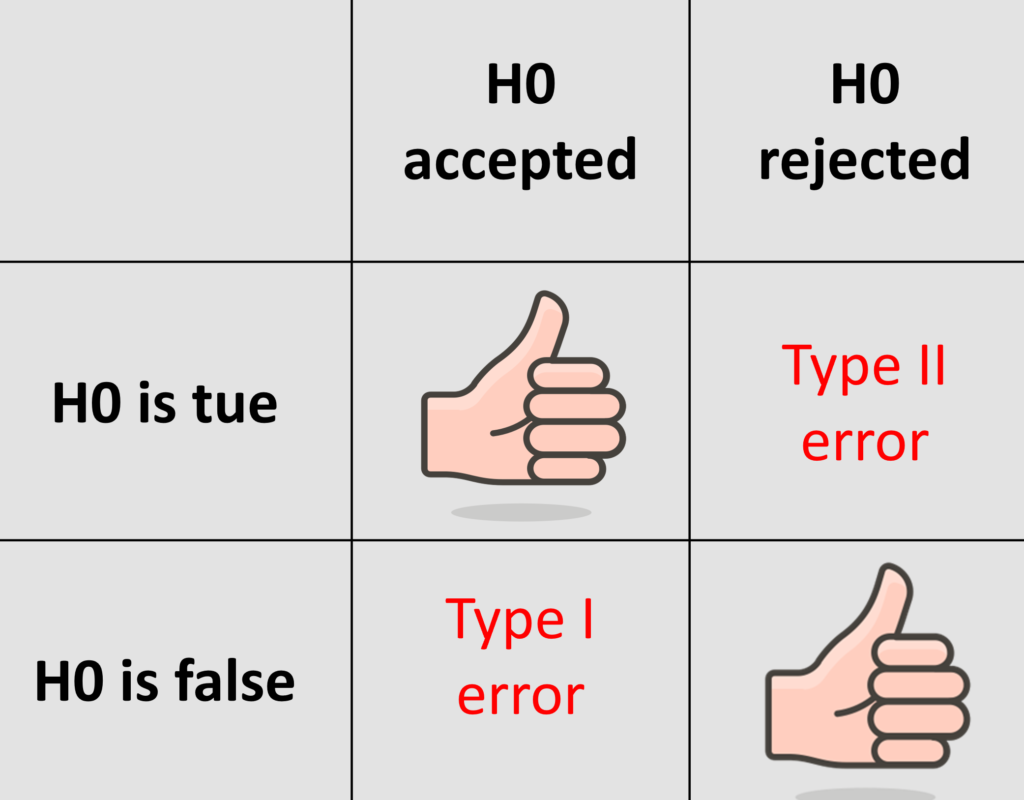
When evaluating statistical hypotheses, two types of errors can occur:
- Type I error: The null hypothesis is true but is rejected (False Positive)
- Type II error: The null hypothesis is false but is accepted (False Negative)

SIZE, in statistical terms, refers to the probability of committing a Type I error. This concept is crucial in the design phase of statistical analysis, as it directly corresponds to the predetermined significance level, commonly denoted as α. Understanding SIZE helps researchers control the risk of falsely rejecting a true null hypothesis.
POWER, on the other hand, represents the ability to avoid a Type II error, which occurs when failing to reject a false null hypothesis.
Enhancing statistical power is a delicate balancing act. One approach to increase power is by adjusting the alpha level upward, but this strategy comes with a trade-off: it simultaneously increases the risk of Type I errors.
An alternative and often preferred method to boost power is to expand the sample size, thereby increasing the number of observations in the study.
Power analysis plays a critical role in research design by determining the optimal sample size needed to minimize the risk of both Type I and Type II errors. This analytical technique helps researchers strike a balance between statistical significance and practical feasibility, ensuring that studies are neither underpowered (risking missed effects) nor overpowered (wasting resources). By conducting a thorough power analysis, researchers can confidently determine the number of participants or observations required to detect meaningful effects while maintaining the integrity of their statistical inferences.
The statistical hypothesis forms the foundation of inferential statistics, serving as the starting point for analyses that draw conclusions from data samples. A clear, precise formulation of null and alternative hypotheses enables the construction of statistical tests for making informed decisions under uncertainty. Without well-defined hypotheses, statistical inference loses direction and significance, rendering it impossible to accurately interpret results or validate conclusions.


