Choosing the right statistical test for our analysis depends on several key factors:
- Type of data
- Data distribution
- Sample size
- Study design
- Study objective
- Required precision
Type of Variables
The nature of your dataset’s variables is crucial in choosing the right statistical test. Categorical variables (like sex or blood type) and numerical variables (such as age or weight) require different approaches.
For categorical variables: • Chi-square test of independence or Fisher’s exact test assess relationships between variables. They’re useful for examining associations between two or more categorical variables. • Chi-square is better for larger samples, while Fisher’s exact test suits smaller samples or low expected cell frequencies.
For numerical variables: • Test choice depends on data distribution and other assumptions. • Parametric tests (t-test, ANOVA) are used when data is normally distributed and meets specific criteria. • Non-parametric tests (Mann-Whitney U, Kruskal-Wallis) are alternatives when data doesn’t meet parametric test assumptions.
The choice between parametric and non-parametric tests for numerical variables depends on data distribution. This can be assessed through histograms, Q-Q plots, or formal tests like Shapiro-Wilk.erving the sample data if the null hypothesis is true. If this probability is less than 5% (or 0.05), they reject the null hypothesis in favor of the alternative hypothesis.
Data Distribution
Data distribution is another crucial aspect. Parametric tests, like the t-test or ANOVA, require normally distributed data with homogeneous variances across groups. When these assumptions aren’t met, non-parametric tests such as the Mann-Whitney test or the Kruskal-Wallis test are often better choices. It’s essential to check data normality using tests like the Shapiro-Wilk or Kolmogorov-Smirnov, and to assess variance homogeneity with the Levene’s test before selecting the appropriate statistical method.
Sample Size
Sample size significantly influences test selection. For small samples, non-parametric tests are often more robust, as parametric tests may yield less accurate estimates. Conversely, with large samples, parametric tests typically maintain good statistical power, even when data slightly deviates from normality—a phenomenon explained by the central limit theorem.
Study Design
The study design significantly influences test selection. For repeated measures, such as in longitudinal studies where subjects are measured multiple times, it’s crucial to use tests that account for data dependency. Examples include the paired t-test or repeated measures ANOVA. Conversely, when comparing independent groups, classic tests for independent data are more suitable, such as the independent samples t-test or one-way ANOVA.
Study Objective
The study objective is crucial in guiding test selection. For comparing two means, a t-test is often suitable. When comparing more than two groups, ANOVA becomes necessary. To explore relationships between variables, consider regression analysis for identifying linear relationships or correlation for general associations.
Required Precision
Finally, consider the required level of significance, typically set at a p-value of 0.05. This affects both the chosen test and the effect size you aim to measure. When conducting multiple comparisons, apply tests with appropriate corrections (such as the Bonferroni correction in an ANOVA) to prevent false positives.

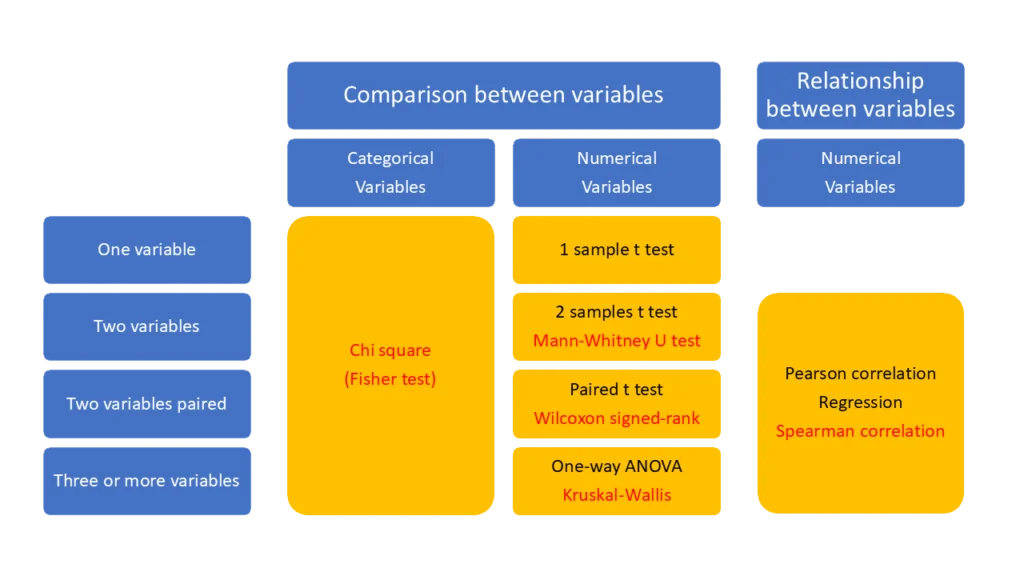
The diagram above presents a framework for selecting statistical tests based on variable types and the nature of comparisons or relationships being studied.
Parametric tests are displayed in black, while non-parametric tests are shown in red.
Here’s a summary of the categories outlined in the diagram:
- Comparison between categorical variables:
- Chi-square test (Fisher’s exact test): Suitable for comparing two or more categorical variables, particularly when assessing group associations. Fisher’s exact test is preferable for small sample sizes.
- Comparison between numerical variables:
- One-sample t-test: Tests whether a single numerical variable’s mean differs from a known value.
- Independent samples t-test: Compares means between two independent groups.
- Mann-Whitney U test: Non-parametric alternative to the t-test for two independent groups when data violate normality assumptions.
- Paired t-test: Compares means between two related groups (e.g., before and after treatment).
- Wilcoxon signed-rank test: Non-parametric alternative to the paired t-test for related groups when normality cannot be assumed.
- One-way ANOVA: Compares means among three or more independent groups.
- Kruskal-Wallis test: Non-parametric alternative to ANOVA when data violate normality assumptions.
- Relationship between numerical variables:
- Pearson correlation: Measures the strength and direction of linear relationships between two numerical variables.
- Regression: Models relationships between numerical variables.
- Spearman correlation: Non-parametric alternative to Pearson correlation for non-linear relationships or when data violate normality assumptions.


